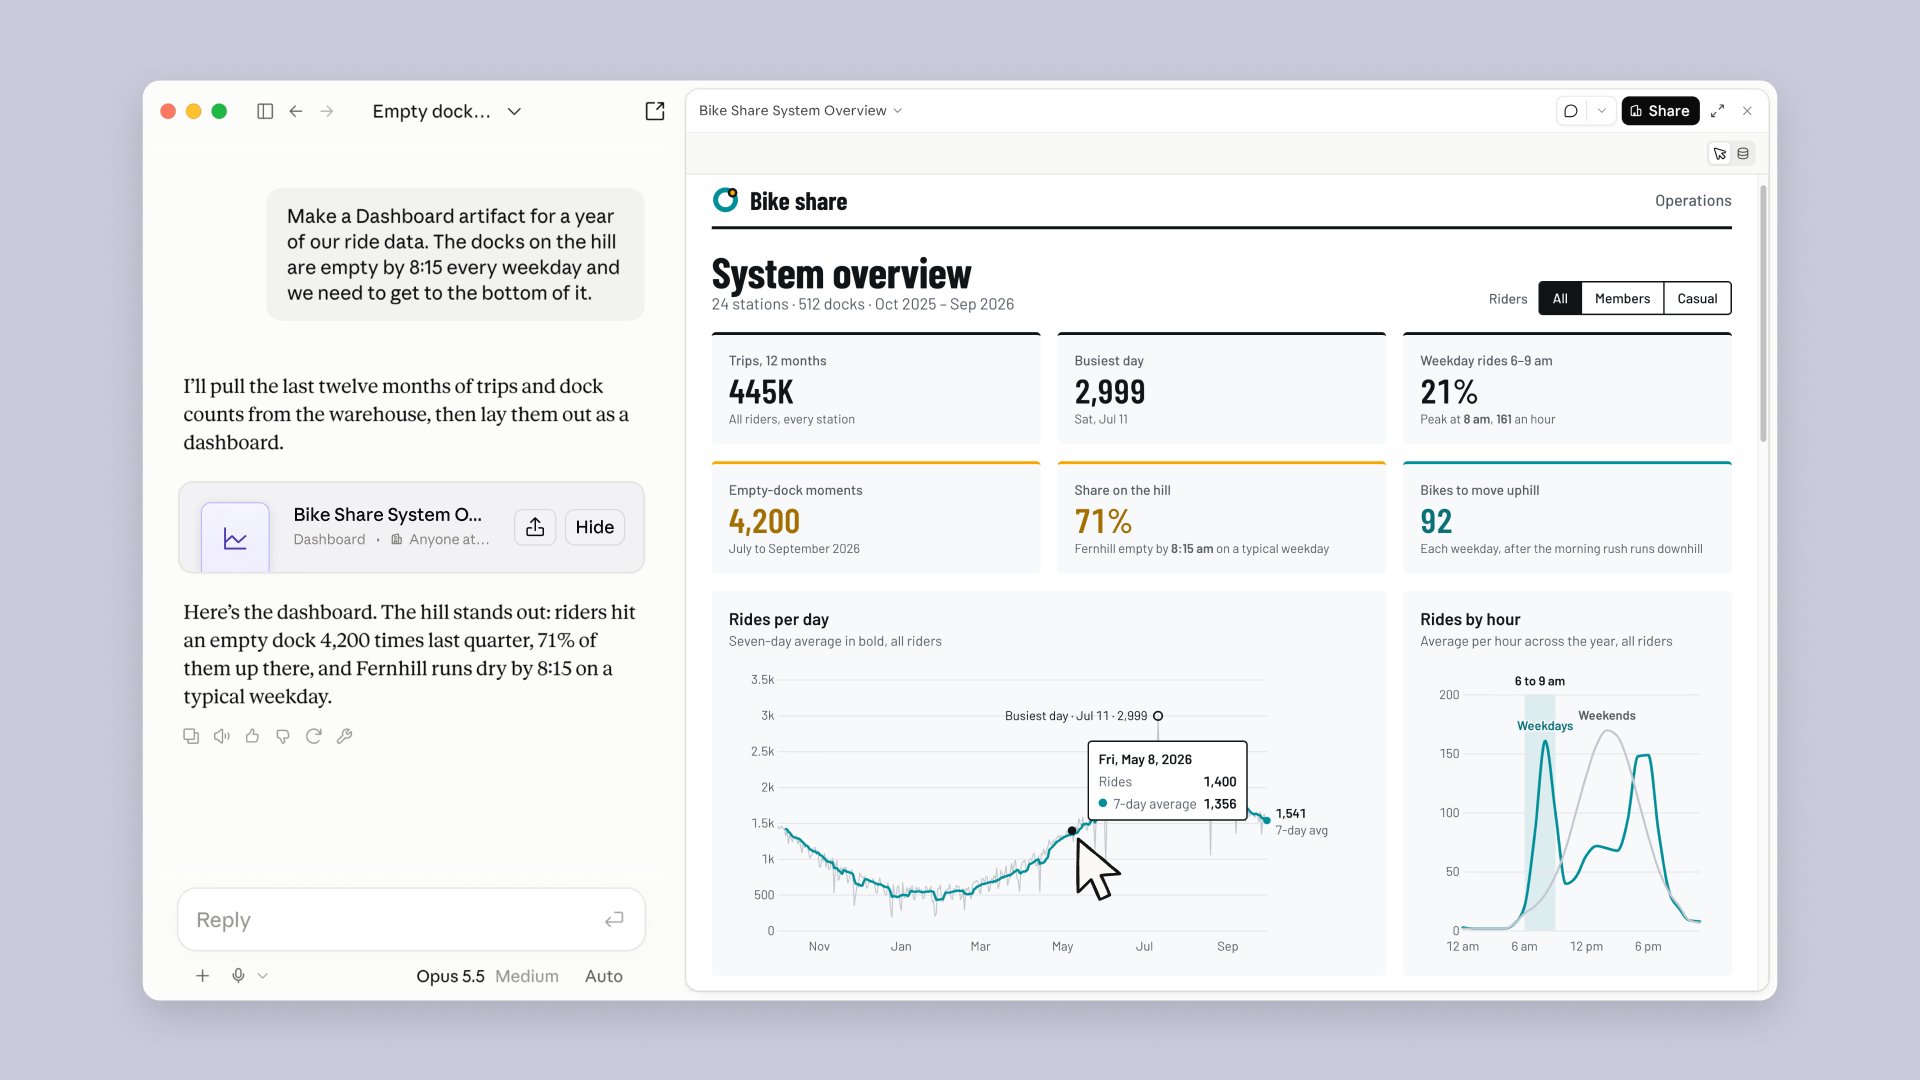
Claude can now turn a question into a live dashboard and a message into a thirty-second animated film. For Europe’s small businesses the news is not that the work gets cheaper. It is that the people who know the business best can finally show what they know.
FROM THE EDITORS
Every small firm has someone who knows the numbers by heart and has never been able to draw them. The sales lead who can tell you which customers are slipping, but not in a chart. The technician who can explain the new heat pump better than any brochure, but has never made a film. On 8 October Anthropic handed both of them a pen.
Claude Dashboards and Claude Motion arrived in beta the same day Anthropic moved Docs, Slides and Design out of beta and onto every Claude plan, Free included. Anthropic says more than 45 million docs, decks and designs have been made in Claude since those tools appeared. First came the page. Now come the chart and the screen.
A question becomes a dashboard
Dashboards, on paid plans, starts with a question in plain language: how do this week’s signups compare with last month’s? Claude pulls the answer from connected data, builds the charts and keeps them current as the data changes. Each chart shows when it was last refreshed. Click any number and you see the query behind it, and Claude will explain it.
That last detail is the generous one. A dashboard that shows its working is a dashboard everyone in the room can understand, question and learn from, not only the person who built it. Finished dashboards can also be sent on to analysis tools such as Amplitude, Grafana, Hex, Mixpanel, PostHog and Sigma, with Looker, monday.com and Tableau listed as coming soon, so the colleague or partner who lives in those tools can pick up where the question left off.
For a firm in Odense or Bordeaux, the first step is practical. The data sources Anthropic names first are warehouses: Amazon Redshift, BigQuery, ClickHouse, Databricks, Snowflake, plus Salesforce. Many small businesses run on a spreadsheet, an accounting package and a webshop instead. Anthropic says other connectors work too. The useful question is simply where your own numbers live, and how to let Claude reach them.
A message becomes a film
Motion, for Team and Enterprise plans, turns a prompt into a short animated explainer: a thirty-second all-hands update, an onboarding walkthrough. You type /motion, Claude builds it, and it plays like a video and downloads as an MP4. You edit it in the editor or ask Claude to revise it.
The thoughtful design choice is what Motion is made of. It is not a video-generation model. It is code that animates text, charts, shapes and images, so the words, numbers and timing stay editable, and there is no generated footage and no AI-generated people. When a price changes, you change a number. Your real colleagues stay the faces of your company. And projects can be opened in Adobe, Descript, HeyGen, Runway and others, with Canva listed as coming soon, so a designer or video partner can take a rough cut and make it shine.
More hands at the workbench
The obvious worry: does this replace the analyst and the studio? The better reading is that it widens the circle. A dashboard used to begin with a ticket and a wait. A film began with a brief and a budget. Now both can begin with a sentence from whoever has the idea, which means more ideas get tried.
That is good news for the specialists too. The quick, exploratory question that Anthropic says Dashboards suits best is rarely the work an analyst enjoys most. The thirty-second update is rarely the film a studio is proudest of. When the first draft is easy, experts spend their time on the work that needs them: the model that drives a decision, the campaign that defines a brand. Small firms get more done, and the people around them get to do their best work.
Before you press play
Three things are worth setting up first.
The plan. Dashboards needs a paid plan. Motion needs Team or Enterprise. For Enterprise customers both arrive switched off and are enabled by an admin under Organization settings, Artifacts.
The sharing. Teams and Claude can now edit the same doc, deck, design or dashboard together. Sharing outside the company, or with anyone holding the link, depends on admin settings. Agree who can see a live dashboard before it starts travelling.
The move. If your team used the standalone Claude Design site, it stays open until 14 December. Design systems can be moved across, but chats and project comments do not carry over, and public links to standalone projects stop working when the site closes. Update any links you have shared.
What to try this week
- Ask one real question. Let the person who checks a number every Monday ask Claude for the chart. See what they notice that nobody had drawn before.
- Click the number together. Open the query behind one chart with the person who owns that data. It is the fastest way to build trust in the board.
- Make one thirty-second film. Ask the colleague who explains your product best to make it. Then show it to your designer or video partner for polish.
- Agree the sharing settings before the first dashboard leaves the building.
- Move your Design projects before 14 December if you used the standalone site.
Small firms have always had the knowledge. What they lacked was the time and the tools to show it. This week the chart and the film moved into the same chat box as the question. The firms that gain most will be the ones that hand the pen to the people who know the story.
Sources
- Anthropic, “Dashboards and Motion”, 8 Oct 2026 — https://claude.com/resources/articles/dashboards-and-motion
- Signal Digital, “The Rival Just Got a Desk in Google’s Office”, 6 Oct 2026 — https://signaldigital.net/2026/10/06/the-rival-just-got-a-desk-in-googles-office/
- Signal Digital, “Five Labels, One Brewery”, 7 Oct 2026 — https://signaldigital.net/2026/10/07/five-labels-one-brewery/
Leave a Reply